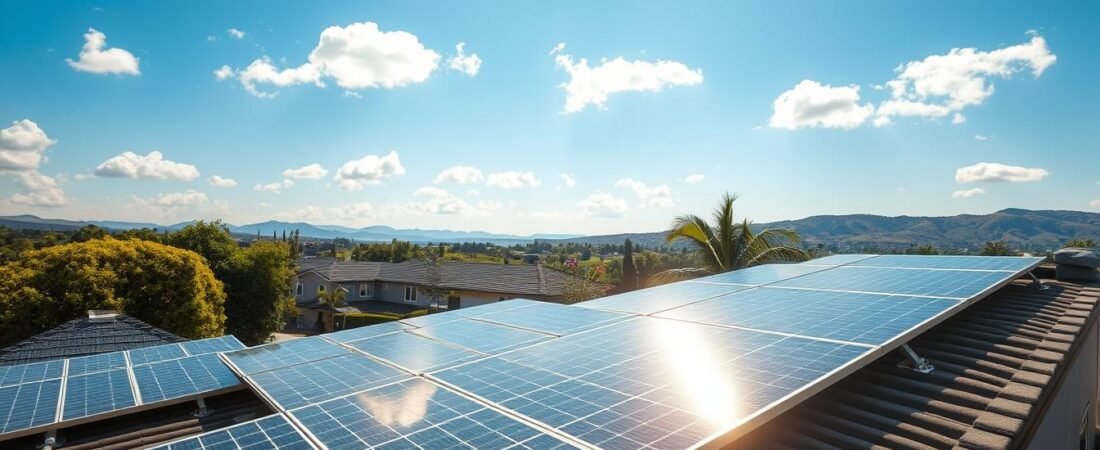
Thinking about a rooftop setup? This guide breaks down the true price you can expect when exploring renewable power for a home in the United States.
Prices have changed a lot in recent years. Back in 2010, residential rates ran near $7 per watt. By 2026, that figure falls by more than half, so upfront price now looks very different.
Still, there is no one-size-fits-all answer. Equipment, labor, roof condition, size and local incentives shape the final bill. Homeowners who study site specifics often find installing panels helps cut electricity use and locks in long-term savings.
Our short guide walks through key variables—from permits and interconnection rules to tax credits—and offers real price ranges. Read on to plan a smart investment that fits your home, budget, and goals.
Understanding the Real Cost of Solar Panel Installation
Installer quotes today often look very different than a decade ago. Back in 2010, residential rates ran about $7 per watt; by 2026 that figure dropped more than half thanks to better tech and tougher competition.
How buyers compare offers: the industry uses dollars per watt to make quotes apples-to-apples. After the 30% federal tax credit, many homeowners pay between $18,000 and $38,000 for systems sized 5 kW to 15 kW. Commercial setups from 50 kW to 200 kW often land between $65,000 and $210,000 once incentives apply.
- Upfront drivers: equipment, labor, roof work, and system size.
- Long-term value: electricity savings and protection against rising rates.
- Timing matters: the federal credit is time-sensitive and can cut your net price significantly.
Smart planning—like comparing $/W quotes and checking local incentives—helps protect investment value and long-term savings.
How Market Trends Influence Solar Pricing
Market forces and tech shifts have reshaped rooftop pricing across states. Regional demand, local rules, and manufacturing gains all play roles in how panel costs land on your quote.
Technological advancements have pushed module output higher while trimming equipment and labor needs. Modern panels produce more energy per square foot than models from ten years ago, which helps lower per watt pricing and raises long-term value.
Technological Advancements
Efficiency gains mean smaller arrays can meet the same load. That reduces roof work and some electrical upgrades, lowering system cost and maintenance over many years.
Market Competition
Competition among manufacturers and installers has driven prices down in mature markets. Arizona, for example, offers rates near $2.06 per watt, while places like Wyoming and Nebraska exceed $3.50 per watt due to fewer installers and slower permitting.
- Virginia averages roughly $2.52/W, with systems ranging about $30,045–$40,649.
- SunShot tracks LCOE to compare long-term affordability across regions.
- Homeowners in high electricity cost states often see stronger savings despite higher upfront price.
“Regional labor, permitting, and local incentives shape final prices more than a single manufacturer’s list price.”
Why Your Home Size Is Not the Primary Cost Driver
Energy use and household habits drive system sizing far more than floorplan area. A 1,200 sq ft house with an EV and four people often needs a larger array than a 2,000 sq ft house with a single occupant.
The main goal when adding panels should be to offset close to 100% of your electricity use. Installers measure needs in kilowatt-hours, not square feet, so consumption sets the true system size.
Roof area only matters when space limits how many modules you can place. If your roof is tight, a ground mount system can bridge the gap and help reach your energy target.
Many homeowners assume a bigger house equals bigger costs. That misconception skews budgets and expectations. Focusing on usage lets installers design a more efficient system and improves long-term savings and investment value.
- Consumption-driven design: appliances and lifestyle set panel count.
- Space solutions: ground mounts and layout tweaks avoid oversizing.
- Better budgeting: size systems by energy need to predict true costs and savings.
Key Components That Impact Your Total Investment
Your total investment often comes down to a handful of component choices and site-specific upgrades. Each selection changes how much you pay upfront and how much you save over years.
Panel efficiency and power
Higher power density panels—say 600 watt versus 400 watt units—raise price per watt but cut array footprint. That can reduce racking and roof labor for tight sites.
Inverter technology
String inverters usually offer the best value, while microinverters add panel-level control at a premium. Power optimizers pair with string inverters as a middle ground to boost output with lower extra cost.
Electrical upgrades and mounting
Older homes may need a main panel upgrade, often between $2,000 and $4,000. That work protects electrical safety and lets your new system export clean energy.
Roof mounts cost less than ground mounts or carports because they use fewer parts and less labor. Also, bundle any roof repairs with the project to save on mobilization fees.
- Appearance and value: black-framed versus blue-cell panels affect aesthetics and final price.
- Every component matters: racking, wiring, and permits add to system cost but also affect long-term savings and maintenance.
Comparing Installation Methods for Your Property
A smart mounting choice often trims parts, labor, and roof work without cutting output.
Roof mounts attach to existing structure and usually offer the lowest per watt expense because they require less labor and fewer materials.
Shingle roofs need flashing and careful sealing. Metal seams accept racking directly, which can speed work and reduce labor costs.
Flat roofs often use ballast mounts. Concrete blocks hold arrays in place and avoid penetrating the roof surface.
Ground mounts let you tilt for ideal sun exposure. That can cut the number of panels needed to reach the same energy output as some roof systems.
| Mount Type | Typical Labor Impact | Performance | Best For |
|---|---|---|---|
| Roof mount | Low–Medium | Good | Most homes with usable roof area |
| Ballast (flat roof) | Medium | Good | Flat commercial or residential roofs |
| Ground mount | Medium–High | Excellent | Properties with open land and shading concerns |
| Carport | High | Very Good | Homes lacking roof space; adds covered parking |
Professional installers assess roof angles, shading and financial incentives to pick the best balance between appearance and long‑term savings.
Keep in mind: complex roofs with many dormers raise labor and time. Choose the method that protects equipment and maximizes your investment over years.
The Role of Geography and Local Regulations
Local rules and climate shape both price and performance for rooftop projects.
State and Federal Incentives
Sunlight, labor rates, and permitting rules all affect final price and payback. In some states installers face long permit waits. Utilities may require meter or transformer upgrades that add time and cost.
Federal support remains a major driver. The residential clean energy tax credit lets homeowners deduct 30% of a qualifying solar system from federal taxes. Many states layer rebates, sales tax waivers, or property tax exemptions on top.
| Region | Typical per watt | Common incentives | Local impact |
|---|---|---|---|
| Arizona | $2.06/W | State rebates, net metering | Low prices, strong competition |
| Wyoming & Nebraska | $3.50+/W | Limited rebates | Higher labor, fewer installers |
| National | Varies | 30% federal tax credit | Payback depends on incentives and sunlight |
Tip: verify local interconnection rules and available credits to estimate true payback before you sign a contract.
Navigating Financing Options for Your System
How you pay for a system often changes total outlay far more than equipment choices.
Cash purchases give the best long‑term value. They avoid interest and let homeowners claim full tax incentives directly. That lowers net payments and speeds payback.
Loans let many start with $0 down, but interest can raise total by roughly 20%–47%. For example, a $25,000 system paid over 12 years at 6% totals about $30,500. Stretch that to 25 years at 8% and payments can reach about $46,250.
Leases and PPAs require little upfront money. Yet they remove ownership benefits and may include annual price escalators that change lifetime savings.
Home equity lines of credit often offer lower rates, but use your house as collateral. Always compare total cost of ownership across options before signing.
| Option | Typical Upfront | Long‑term Impact | Best For |
|---|---|---|---|
| Cash | High | Lowest total payments; full incentives | Buyers with savings |
| Loan | Low–None | Higher total payments; immediate savings possible | Budgeted homeowners |
| Lease / PPA | Very Low | No ownership; escalators may raise payments | Renters or low capital |
| HELOC | Low | Potentially lower interest; uses home as collateral | Owners with equity |
Tip: compare total payments, incentives, and warranty coverage to protect your investment.
Hidden Expenses to Consider Before You Buy
Beyond the quote, recurring maintenance and roof timing shape your true investment. Plan for predictable bills and a few surprises to keep payback on track.
Maintenance Requirements
Annual cleaning runs about $150–$300 depending on dust, pollen, and local weather. Simple care helps keep energy output high.
Inverter replacements appear every 10–15 years and usually cost $1,000–$3,000. Factor that into long‑term planning for your system.
Monitoring services and insurance add another $100–$300 and $50–$200 per year, respectively. These fees protect performance and payback.
Roof Condition
If your roof needs work within 5–10 years, bundling saves $10,000–$20,000 in mobilization fees. That move avoids tearing panels down twice.
Storm damage can force panel repair or replacement. Those expenses vary by equipment and warranty, so review coverage closely.
| Expense | Typical Range | Frequency |
|---|---|---|
| Professional cleaning | $150–$300 / year | Annual |
| Inverter replacement | $1,000–$3,000 | Every 10–15 years |
| Insurance & monitoring | $150–$500 / year | Annual |
| Roof bundle savings | $10,000–$20,000 saved | One-time if bundled |
Tip: include routine inspections and warranty checks to avoid surprise costs and protect long‑term returns.
Evaluating the Long Term Return on Investment
A clear ROI view helps homeowners weigh a new array against daily electricity bills and future resale value.
Numbers to consider: U.S. returns often run near a 10% ROI, meaning roughly $10 earned per $100 invested. A 10‑kilowatt system can save about $1,440 per year for a typical household, trimming utility bills while the system produces energy.
Payback timelines vary sharply by state. Some markets, like Hawaii and Massachusetts, reach break‑even in about 4.2 years. Others, such as Wyoming, may take near 19.1 years. Local incentives, net metering and a federal tax credit shift those points dramatically.
Beyond bill savings, systems tend to raise resale value. Recent research shows a home value bump near 6.9% on average, adding an important cash‑out advantage when selling.
“After payback, systems supply essentially free electricity through a 25‑year warranty and often beyond.”
- Inflation hedge: rising electricity rates (about 3.5% annually) improve real returns over years.
- Commercial owners: can accelerate recovery using depreciation plus federal credits.
- Evaluate both: immediate bill reduction and long‑term property appreciation to estimate true ROI.
For a deeper breakdown of returns and regional examples, see this solar ROI guide.
Why Professional Quotes Vary Between Installers
Differences in labor skill, warranty choices, and equipment tiers often create the biggest gaps between bids. Some companies run detailed shade and yield models while others use a quick rule‑of‑thumb. That alone can change a final system price per watt and long‑term production estimates.
The Importance of Warranty Coverage
Warranties matter. A longer workmanship promise or a production guarantee, such as a Triple Ten Guarantee, may raise an initial quote but protect returns over years. Experienced crews charge more, yet they often avoid costly design mistakes that shorten equipment life.
- Compare bids by cost per watt and equipment tier to ensure apples‑to‑apples.
- Ask how each installer models shading, weather, and panel degradation.
- Use marketplaces like EnergySage to get vetted local quotes and foster competition—shopping can save up to 20%.
Tip: choose transparent pricing and clear interconnection help to reduce surprises and protect your investment.
Final Thoughts on Your Solar Journey
Smart planning today helps lock in long‑term protection against rising electricity costs. Act before the federal tax credit ends on December 31, 2025, to capture that valuable tax break and lower net cost.
Compare quotes by output per watt and warranty, not just headline price. Choose quality equipment and a vetted crew so a system lasts many years and keeps energy production steady.
Factor financing, local incentives, and right‑sized array design to boost returns and avoid surprise expenses for your roof or panel maintenance.
Your investment raises home value and supports a cleaner future. We hope this guide made those tradeoffs clearer and helped you move forward with confidence.